WRLD

Search

#Graphique
Clément Molin 2d

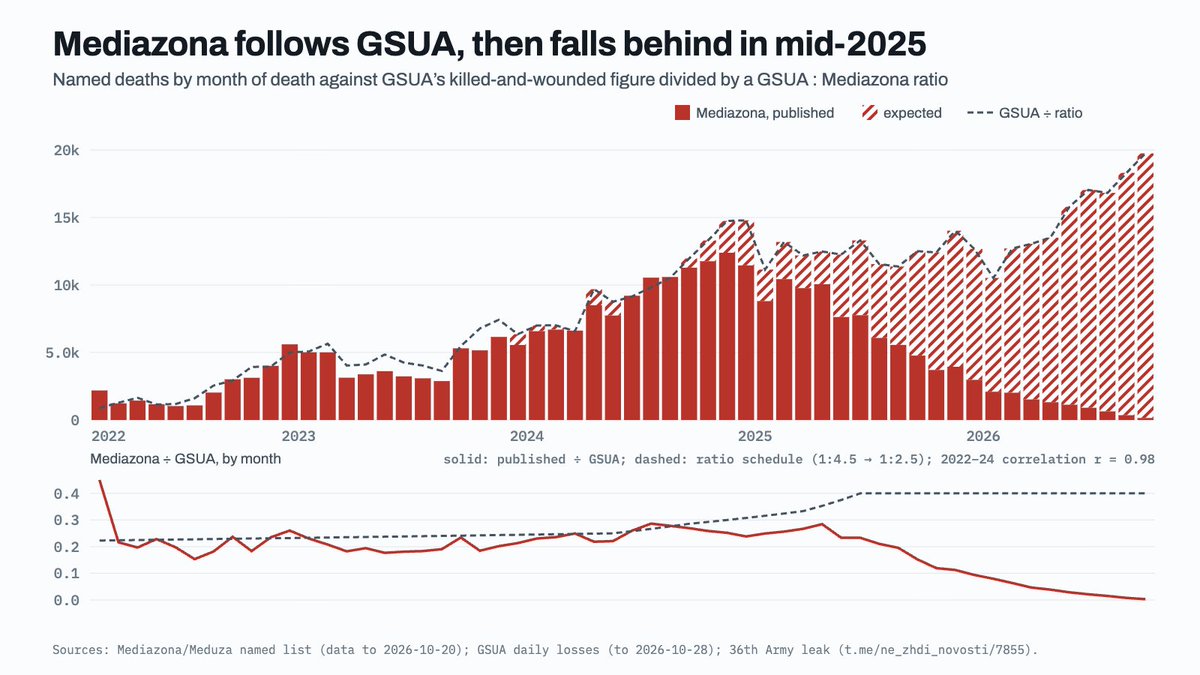
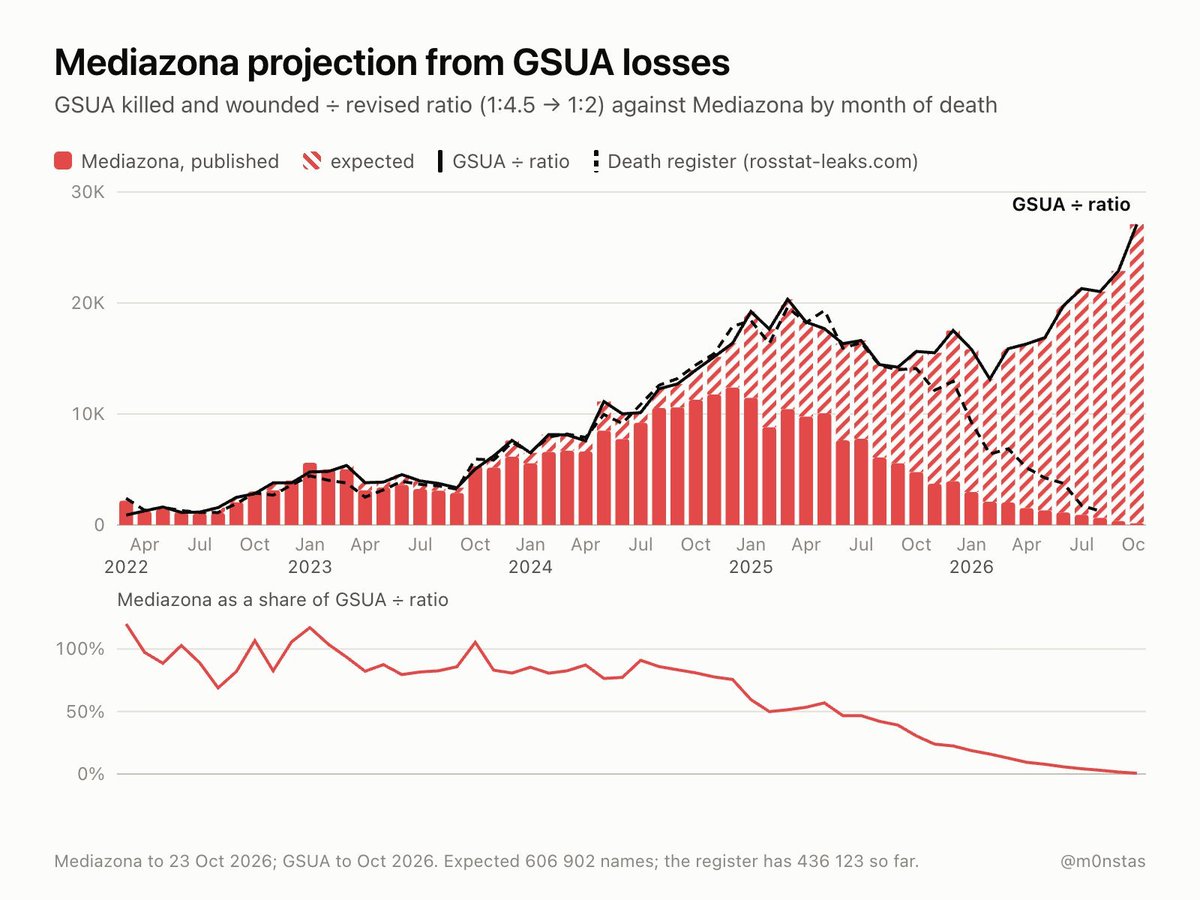
Clément Molin described the war in Ukraine as a conflict that has led to massive human losses. He estimated that about 3% of men aged 18 to 60 in government-controlled Ukrainian territories had been killed, and that an additional 2 to 3% were likely severely injured, amputated, or traumatized. For Russia, he suggested that 1.5% of men in this age group had been killed, and at least 2% more had suffered serious injuries or trauma. On a broader scale of the conflict, Molin assessed the number of dead or severely injured men to be between 1.5 and 2 million, along with a minority of women, mainly Europeans, and some volunteers or mercenaries from other regions. He also mentioned the departure of hundreds of thousands of young men from both countries, declining birth rates, and grieving families. Molin estimated that in Russia, despite probably 600,000 deaths, the war was little contested and the shock remained silent, in contrast to the war in Afghanistan. He suggested two explanations: the dead would mainly be poor, older, non-conscripted men, and the war in Afghanistan occurred in a much more difficult economic and social context. He wrote that Russia was sacrificing its future for villages in Donbass, while imposing the consequences of war on the Ukrainian people, whom he described as being attacked. He added that Ukrainians remained mostly determined to defend their freedom after Russian and then Soviet oppression, the annexation of Crimea, the war in Donbass, and the large-scale invasion. Molin also cited a graph by M0nstas on Russian losses. According to the estimate presented, which compared the 284,000 verified deaths by Mediazona, over 400,000 deaths from a leak from Rosstat, and data from the Ukrainian army, with a ratio of killed to wounded adjusted according to the years, the toll was between 580,000 and 620,000 dead. #Ukraine #Guerre #Conflit (translated)

3559
Neros 4d

Neros accused Sardoche of having shared a graph extending to 2025 when, according to him, Mamdani took office in 2026. He presented this as an example of the level of misinformation from the right. #Désinformation #Politique #Graphique (translated)

2921
Marc Vanguard 1w

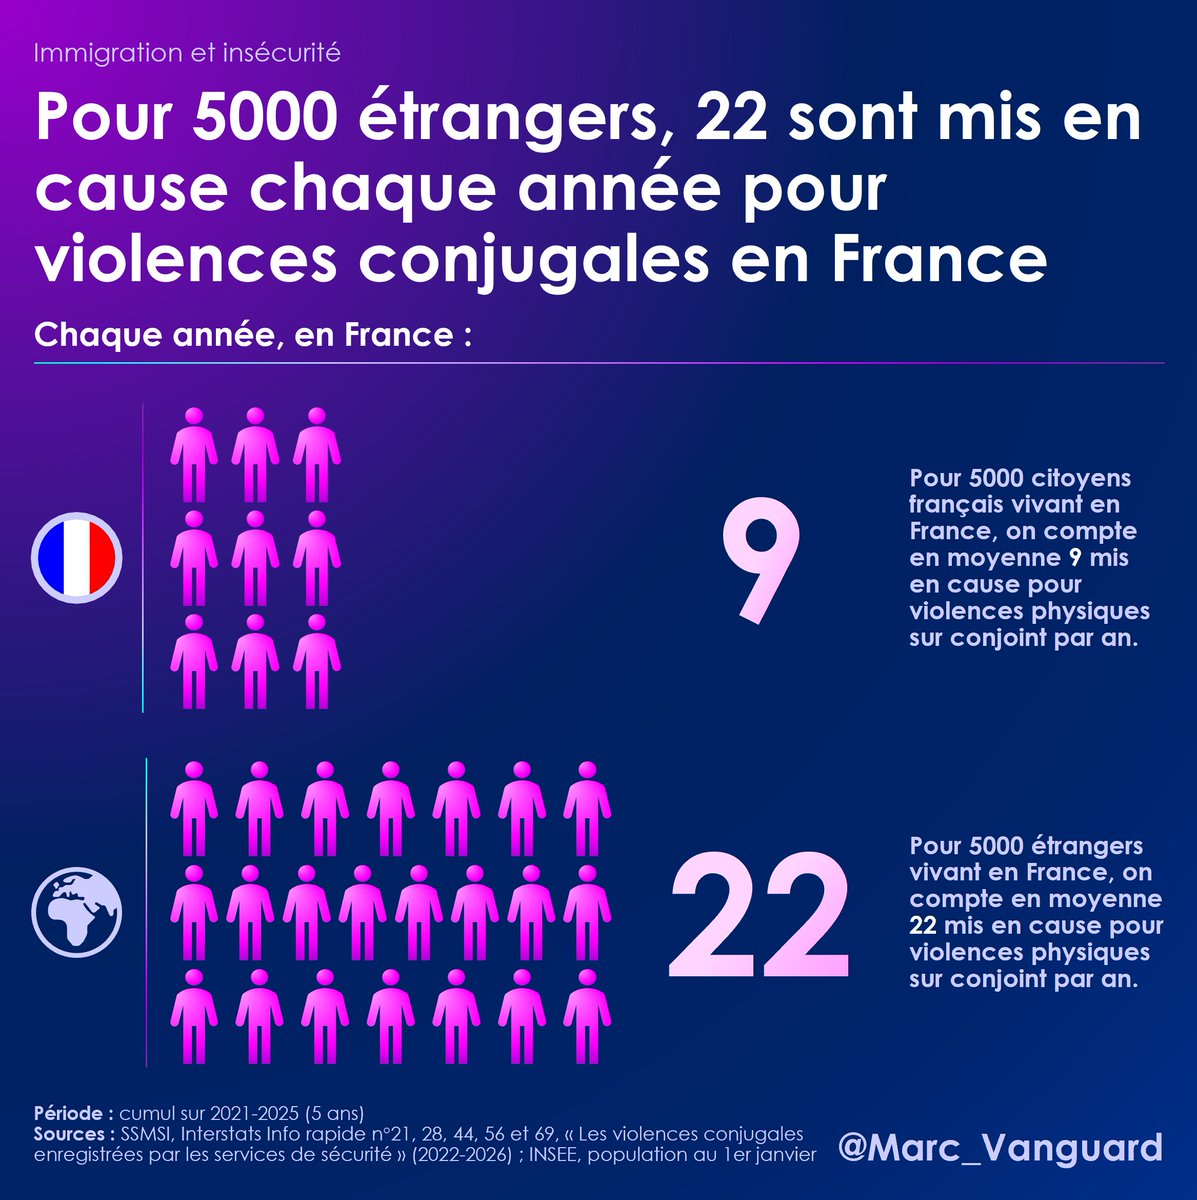
Marc Vanguard indicated that the Ministry of the Interior had published new data on recorded domestic violence. He stated that foreigners were significantly overrepresented among the individuals implicated and presented a thread of five graphs on the subject. https://t.co/M7umebLQyS #ViolencesConjugales #Données #Intérieur (translated)

3541
Edwy Plenel 2w
French journalist and writer

The author wrote that poverty in France had reached its highest historical level in thirty years. He indicated that its increase, presented in the form of graphs, particularly affected single-parent families and the youngest, and resulted in material deprivation. https://t.co/BYUNxqBNxd https://t.co/eKcjRbzWph #pauvreté #France #société #FR (translated)

3432
Le Monde.fr 2w

The article presents a visual representation in maps and charts of the early lessons from the 2026 midterm elections. #BrowserIssues #NetworkProblems #AdBlocker (translated)

www.lemonde.fr
Midterms 2026 : visualisez en cartes et en graphiques les premiers enseignements du scrutin
2748
Marc Vanguard 3w

Marc Vanguard indicated that the Ministry of Justice had quietly published its report on its "key figures." He stated that he had created four charts from this document and claimed that 45% of the people convicted of offenses were already known to the justice system. https://t.co/XF7JgpGICr #Justice #Rapport #Statistiques (translated)

3345
Clément Molin 3w

Clément Molin estimated that the war in Ukraine had caused nearly one million deaths among Ukrainian and Russian military personnel. He emphasized that the available counts were partial and that both sides were attempting to hide their losses. According to the figures he presented as verified, the Ukrainian toll amounted to 106,000 dead, 105,000 missing — the majority of whom were likely dead — and 12,000 prisoners of war, totaling approximately 224,000 losses. For Russia, he reported 282,000 dead and at least 70,000 additional deaths by the end of 2025, amounting to about 352,000 losses, while noting that losses for 2026 were almost absent from the counts. Molin cited the work of M0nstas, based on data from Mediazona and Ualosses, indicating that official Ukrainian figures were comparable to Russian losses when considering the changing ratio of killed to wounded. He concluded that Russian losses might actually be between 500,000 and 600,000 dead. For Ukraine, he estimated the toll to be between 300,000 and 400,000 dead, considering this estimate more difficult to reach. He reported that Ualosses faced challenges in obtaining precise data for major cities, Transcarpathia, and the occupied south and east. He added to the death toll the volunteers and foreign mercenaries, Ukrainians from occupied territories conscripted into the Russian army and killed in combat, as well as 2,000 North Koreans killed in Kursk. He also reminded that, in his view, the number of wounded was at least twice that of the dead, and that tens of thousands of people had been amputated on both sides. In this regard, he cited the official Ukrainian figure of 1.5 million military losses. Molin estimated that the total death toll therefore exceeded one million and called for the consideration of psychological trauma, desertions, and demobilized soldiers. He described the war as a "bloodbath" and wrote that each year seemed more deadly than the last. #Ukraine #Guerre #Conflit (translated)

3577

The French Mileistes have recommended sharing a graph in view of the 2027 election. They stated that France was by far the most heavily taxed country in the OECD and that the tax burden on the French was worsening year by year, while tax revenues had not increased as a share of GDP in 30 years. They presented this situation as a "Laffer effect": according to them, beyond a certain level, increasing taxes reduced revenues. They also argued that Denmark taxed much less than France, while receiving as much revenue as a share of GDP and more per capita. They criticized successive French governments for continuing to raise taxes, describing the economy as already very weakened. #Fiscalité #Élection2027 #France (translated)

3003
Dr. Serge Zaka 4w

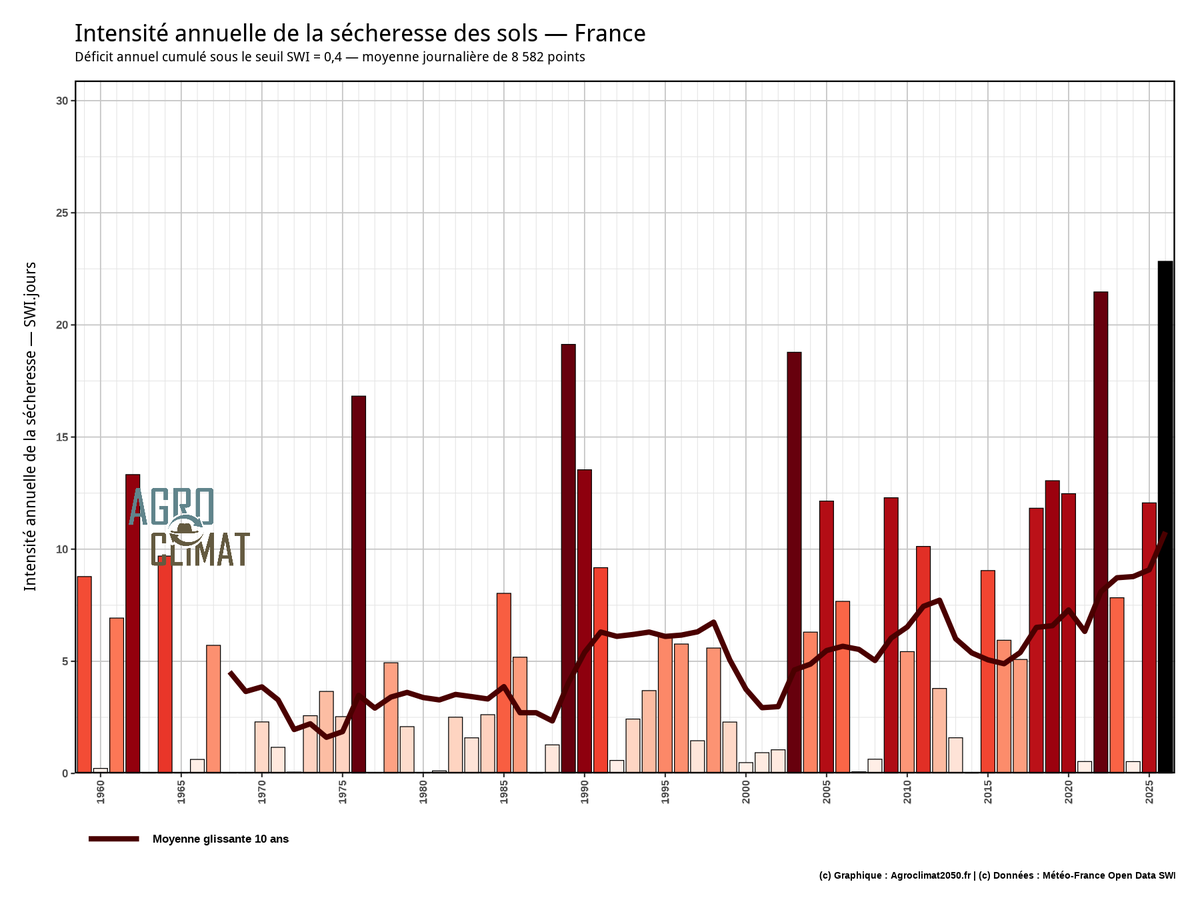
France, at the national level, is still experiencing drought. The soils are only filled to 28% (the "drought" threshold is 40%, chart 1). (translated)

3134
P
Paulo Figueiredo 4w

"We will get rid of Lula for good," assured the influencer Paulo Figueiredo on the social network X, sharing a Polymarket graph showing that, according to bettors, the son of former far-right president Jair Bolsonaro had a 63% chance of winning. #Brésil #Élections2026 #FlavioBolsonaro (translated)

Au Brésil, les finalistes de la présidentielle ont la cote
www.lalibre.be
3141
Clémence Guetté Oct 15
French politician

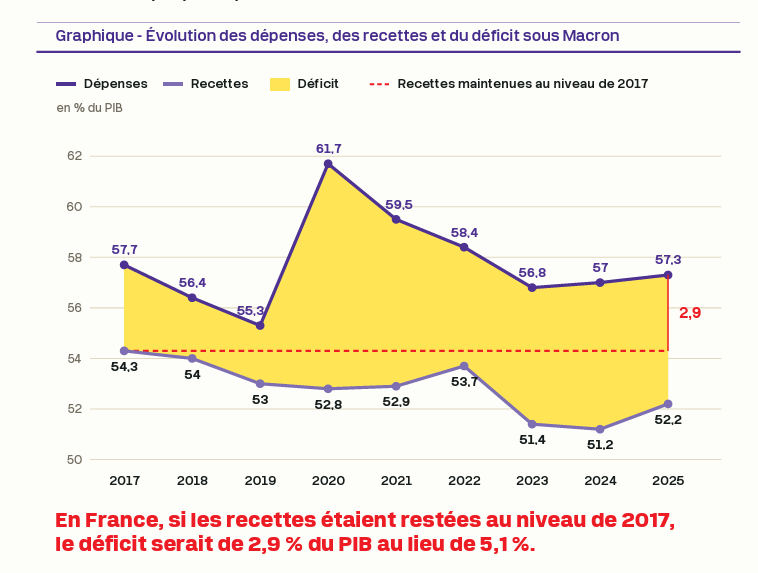
The author stated that the graph showed the evolution of France's revenues and expenditures since Emmanuel Macron took office. According to him, the deficit was not due to an increase in spending, which remained at the same level as it was ten years ago, but rather to a collapse in revenues under Emmanuel Macron. https://t.co/zuVUL4rQbC #France #Macron #Economie #FR (translated)

2797
Antoine Copra Oct 15

Antoine Copra stated that Gabriel Zucman had published the same graph as LFI on the same day, in order, according to him, to make people believe that France had a revenue problem rather than a spending problem. He added that the choice of 2017, a record year, as a reference constituted a misleading method that he claimed had been debunked "X times," and then asked if Zucman was a member of a party. #Économie #France #PolitiquesPubliques (translated)

3030
FRENCHRAPUS 🇺🇸 Oct 13

FRENCHRAPUS claimed that NVIDIA had officially stopped production of its RTX 5090 graphics card. According to him, the company preferred to focus on artificial intelligence chips for data centers, as they were making more money. https://t.co/Sxexd0TZDW #NVIDIA #RTX5090 #IA (translated)

3033
Le Monde.fr Oct 9

The article presents seven graphs to assess the state of the high school student movement and the school system in France. #ProblemasDeCarga #ConexiónAInternet #ExtensionesDeNavegador (translated)

www.lemonde.fr
Mouvement des lycéens : 7 graphiques pour mesurer l’état de l’école
2688
Thomas Astruc ⏚ Sep 26
French animator, director, screenwriter and storyboard artist

Transformons ceci en leçon de design: regardez comment les choix graphiques pour chaque personnage raconte son histoire et sa personnalité, tandis que le personnage rajouté ne véhicule absolument rien. L'usage de L'IA ne révèle jamais un sens artistique mais trahit son absence. #Design #IA #Personnalité #FR

2232
Mr. Numberwise Sep 24

Le Trésor des Fourmis : Là où les chemins se rencontrent — French Une aventure mathématique visuelle avec algèbre et graphiques www.amazon.fr/dp/B0GX34PQDB Les mathématiques visuelles rendues claires Mr. Numberwise Le Trésor des fourmis : Là où les chemins se rencontrent est une histoire visuelle de mathématiques qui transforme les équations, les graphiques et les coordonnées en une aventure que les enfants peuvent vraiment voir et comprendre. Lorsque Mia et Alex découvrent deux mystérieux chemins de fourmis qui se croisent sur la plage, ils rencontrent Mr. Numberwise — un guide calme qui leur montre que les mathématiques ne sont pas seulement des nombres sur une page, mais aussi des histoires, des chemins, des motifs et des découvertes. À travers des fourmis, des cartes au trésor, des escaliers, des chemins colorés et de passionnants moments « Aha ! », les enfants découvrent : • les équations linéaires • la pente • les coordonnées • la représentation graphique • les intersections et les points de rencontre Ce livre utilise des modèles visuels originaux pour rendre l’algèbre plus facile à comprendre : • la pente devient un escalier • une équation devient la recette d’un chemin • +b devient l’étage de départ • les coordonnées deviennent l’adresse d’un point • une intersection devient l’endroit où se rencontrent deux histoires-chemins différentes Ce livre combine : ✔ une histoire ✔ des explications visuelles ✔ des exercices résolus ✔ un apprentissage étape par étape ✔ des dessins et des graphiques ✔ des fiches d’entraînement ✔ des explications dans le style « Math Made Clear » ✔ des moments « Aha ! » mémorables Au lieu de mémoriser des formules, les enfants commencent à voir comment les mathématiques bougent. Parfait pour les enfants curieux, les penseurs visuels, les familles qui font l’école à la maison, les classes et les enfants qui découvrent l’algèbre pour la première fois. Conçu principalement pour les 10–14 ans, ce livre peut aussi aider les élèves plus âgés qui trouvent l’algèbre difficile et qui ont besoin d’une explication plus claire et plus visuelle. Et, honnêtement… beaucoup d’adultes comprendront peut-être enfin mieux la pente grâce à ce livre aussi. Une histoire visuelle de mathématiques avec des exercices résolus — conçue pour que l’algèbre devienne enfin claire. #équationsEtGraphiques #apprentissageVisuelDesMathématiques #MathématiquesVisuelles #aventuresDétéPourEnfants_9_12Ans #mathématiquesExpliquéesSimplement #algèbreVisuelle #comprendreLes_écuations #Algèbre #Mathématiques #GraphiqueDeLaFonction #Graphique #Droite #PenteDUneDroite #LaPenteCestFacile #CestFacile #MrNumberwise #AnxiétéMathématiqueChezLesEnfants #AiderLesEnfantsÀSurmonterLAnxiétéLiéeAuxMathématiques #SurmonterLAnxiété #Anxiété #Kids #20060923 #0253 #Français #PlageDeLaCôteDesBasques #PlageDePampelonne #PlageDePalombaggia #PlageDuSillon #PlageDeLEspiguette 20261006: 917(395)8 #Heureux #ÉducationHeureuse #EnfantsHeureux #MathsHeureuses

940
Dividend King 👑 Sep 24

Ne vous moquez pas des enfants qui croient encore au Père Noël, Certains adultes voient ce graphique et continuent pourtant de penser qu’ils auront encore une retraite par répartition dans 20, 30 ou 40 ans. https://t.co/C8r0nMeOwI #Retraite #Économie #Noël

13399
Dr. Serge Zaka (Dr. Zarge) Sep 22
agroclimatologist

Les chiffres de la sécheresse de 2026 deviennent dingues ! Ca y est ! Elle coche toutes les cases des records caractérisant une sécheresse ! 1⃣ La sévérité : la sécheresse de 2026 devient la plus sévère jamais observée en France alors qu'elle n'est même pas terminée (Graphique 1 - sévérité = intensité x durée). La sévérité de sécheresse a presque triplé en France depuis 50 ans. 2⃣ L'intensité : la sécheresse de 2026 est la plus intense jamais observée avec deux pics. Le premier en août avec le record absolu de sécheresse des sols français : il ne restait plus que 10% du potentiel d'eau des sols français ! Le deuxième pic est en cours totalement inédit par son intensité HORS SAISONS. Un décrochage total par rapport à ce qu'on a connu jusqu'à présent (graphique 2). 3⃣ La surface : la sécheresse de 2026 est la plus étendue au niveau des records annuels d'intensité (carte 3 sur l'année) mais aussi saisonnier. Au niveau national, elle est la sécheresse la plus tardive jamais observée (carte 4 sur septembre). #Sécheresse2026 #Climat #Environnement

13290
Jean-Luc Mélenchon Sep 22
French politician (born 1951)

Avis aux génies du gouvernement qui font semblant de ne pas savoir comment faire pour baisser les prix à la pompe : la réponse est dans ce graphique. Les marges des raffineurs ont été multipliées par 7,5 depuis le début de la guerre. Chaque jour où vous ne bloquez pas les https://t.co/f3llYqiSi1 #PrixCarburant #GuerreUkraine #MargesRaffineurs #FR

4235
L
Le Soir Sep 21

Deux écoles bruxelloises, l'École de recherche graphique et l'École supérieure des arts Saint-Luc, ont déposé plainte contre un enseignant pour des violences sexuelles signalées par plusieurs étudiantes, entraînant son éviction et l'ouverture d'une enquête judiciaire. #ViolencesSexuelles #EnseignementSupérieur #Bruxelles

www.lesoir.be
Deux écoles bruxelloises déposent plainte contre un enseignant pour des violences sexuelles
8825